
Facebook Ads Reporting: How to Track Performance Easily
Running Facebook Ads without tracking their performance is like driving with your eyes closed—you won’t know if you’re heading in the right direction. Facebook Ads reporting is the key to understanding how your campaigns perform, what resonates with your audience, and where your budget is making the most impact.
With billions of users on Facebook, standing out requires more than just launching ads—you need data-driven insights to refine your strategy. Facebook Ads reports provide a clear breakdown of essential metrics like reach, engagement, conversions, and return on investment (ROI).
In this guide, we’ll dive into what Facebook Ads reporting is, why it matters, and how you can use it to optimize your ad performance for maximum success. Let’s get started!
Hit ‘Play’ Button & Tune Into The Blog!
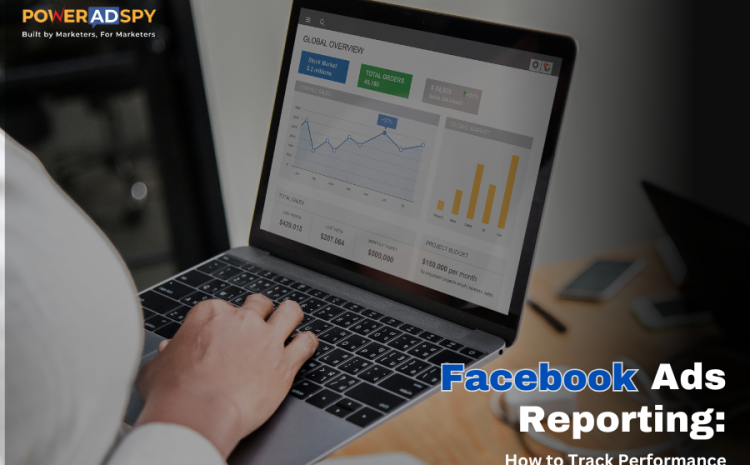
What is Facebook Ads Reporting?
Facebook Advertising reporting is the process of analyzing and tracking the performance of your ads using key Facebook metrics available in Facebook Ads Manager. These reports provide insights into impressions, clicks, conversions, and costs, allowing you to measure ad effectiveness and adjust strategies for better results.
Think of it as a health check-up for your ads. Without these insights, you’d be guessing what works instead of making data-backed decisions.
How Facebook Ads Reporting Works?

When you run an ad campaign, Facebook automatically tracks various data points, such as:
- Who sees your ads (age, gender, location, device, etc.).
- How they interact with your ads (clicks, video views, engagement, etc.).
- What actions they take after clicking (purchases, sign-ups, downloads, etc.).
These insights help you fine-tune your ad strategy by identifying patterns in performance. For instance, if your ad is getting lots of clicks but few conversions, you might need to adjust your landing page.
Types of Facebook Ads Reports
Facebook provides several types of reports depending on your goals:
- Performance Reports – Track key metrics like impressions, reach, CTR, and conversions.
- Audience Insights Reports – Analyze demographic data to understand your audience better.
- Placement Reports – Compare ad performance across different placements (News Feed, Instagram, etc.).
- Creative Performance Reports – Identify which ad creatives (images, videos, copy) perform best.
- Conversion Reports – Measure how many users take the desired action after clicking your ad.
By regularly reviewing these reports, you can make data-driven optimizations that improve your ad ROI.
How to Create a Facebook Ads Report in 6 Steps
1. Access Facebook Ads Manager

To start, navigate to Facebook Ads Manager. This is your central dashboard where you can track campaign performance and generate reports. You’ll find detailed insights on your ads, including spend, impressions, and conversions.
2. Customize Ad Report Columns

By default, Ads Manager includes essential metrics like budget, reach, impressions, and cost per result. However, you can tailor your view by selecting the Columns drop-down menu and choosing the most relevant metrics for your campaign goals. If none of the preset options fit, use Customize Columns to create your own report format.
3. Use Campaign Breakdown for Deeper Insights
 The Breakdown feature allows you to analyze ad performance by different variables, including:
- Delivery – Who saw your ad and how it was delivered.
- Action – What actions users took after seeing your ad.
- Time – Performance over a specific time frame.
Applying these breakdowns helps you understand audience behavior and fine-tune your strategy.
4. Compare Performance Over Time
 Facebook Ads Manager lets you compare performance over different periods using the date selector in the top-right corner. Toggle the Compare option to see how your campaigns have evolved over time. This is useful for tracking seasonal trends, testing strategies, or adjusting budgets based on past performance.
5. Automate Report Generation and Delivery
Instead of manually checking reports, you can automate them:
- Click the three-dot menu in Ads Manager and select Ads Reporting.
- Click Create Report and choose a format (pivot table, bar chart, or trend line chart).

- Customize the report by selecting the metrics you need.
- Click the blue hyperlink in the top-left corner to schedule email reports.
- Set the frequency and add team members to receive automated updates.

6. Save and Export Reports
Once you’ve customized your report, you can save it for future reference. Click the Save option to store it within Ads Manager or export it as a CSV or PDF file for external analysis and sharing with stakeholders.
Why You Need a Facebook Ads Report?
Whether you’re a business owner, marketer, or agency, a Facebook Ads report is essential for several reasons:
1. Transparency & Budget Control
Your ad spend should always align with your business goals. A detailed report provides transparency on where your money is going and which ads deliver the best value. If an ad isn’t performing well, you can pause or tweak it before wasting more budget.
2. Optimizing Performance
Without tracking, you might continue running ineffective ads without realizing it. Facebook Ads reports help you:
- Identify high-performing ads and scale them up.
- Pinpoint underperforming ads and improve them.
- Test different elements (copy, visuals, CTA) to see what resonates best with your audience.
But why limit yourself to just your own ad data when you can uncover what’s working for the best in your industry? An facebook ads reporting tool like PowerAdSpy takes Facebook Ads reporting a step further by letting you analyze competitor ads, track top-performing creatives, and spot trends that can supercharge your strategy. Instead of guessing, you get a clear roadmap to create high-converting ads based on real market insights.
PowerAdSpy: The Ultimate Facebook Ads Spy Tool

While Facebook Ads Manager gives you insights into your own campaigns, PowerAdSpy, a facebook ad spy tool, unlocks a whole new level of competitive analysis. Imagine having access to a massive database of winning Facebook ads, allowing you to see what’s already working in your niche.
Spy on Competitor Ads – Instantly discover high-performing ads from competitors and industry leaders. Get a behind-the-scenes look at their ad copy, creatives, and targeting strategies.
Identify Winning Creatives – Analyze the ad copy, visuals, and CTAs that generate the best engagement. Learn what resonates with audiences so you can craft high-converting ads.
Track Ad Placements & Strategies – See which placements drive the most conversions and adapt accordingly. Optimize your budget by focusing on ad spots that generate the best ROI.
Filter by Niche & Engagement – Find the most viral ads in your industry based on likes, comments, and shares. Narrow down results by keyword, domain, or ad type to find exactly what you need.
Optimize Your Own Ads – Use data-backed insights to craft better ads and maximize ROI. Instead of running endless A/B tests, start with strategies that are already proven to work.
Instead of guessing what works, PowerAdSpy helps you craft data-driven campaigns that stand out in the competitive world of Facebook Ads.
3. Justifying Ad Spend to Stakeholders
If you manage ads for clients or a company, you need to show results. Facebook Ads reports allow you to demonstrate ROI by presenting clear data on conversions, customer acquisition costs, and engagement trends.
4. Scaling Winning Campaigns
When you identify an ad that performs exceptionally well, you can increase its budget or expand its audience reach. Data-driven scaling ensures you invest more in what’s already working rather than guessing.
5. Making Data-Driven Decisions
Successful advertising is not about luck—it’s about strategy. Facebook Ads reports help you:
Adjust targeting to reach the right audience ✔
Optimize ad creatives based on engagement data ✔
Refine bidding strategies for cost-effective campaigns ✔
By leveraging reports effectively, you turn Facebook advertising into a powerful, measurable growth engine for your business.
Key Facebook Ads Metrics to Track
 Not all metrics are created equal. Some look impressive but don’t translate to real business growth. Here are 12 must-track Facebook Ads metrics for actionable fb ads reporting:
1. Impressions & Reach
- Impressions: The total count of times your ad appears on a screen.
- Reach: The number of individual users who have viewed your ad at least once.
Why it matters: High impressions but low engagement? Your targeting might need adjusting.
2. Click-Through Rate (CTR)
Facebook’s click through rate is the percentage of individuals who clicked on your ad after it was shown to them.
Why it matters: A low CTR means your ad creative or copy may not be compelling enough.
3. Conversion Rate
The percentage of users who took a desired action (such as making a purchase or signing up) after clicking on your ad.
Why it matters: If people click but don’t convert, your landing page might need work.
4. Cost Per Click (CPC) & Cost Per Mille (CPM)
- CPC: How much you pay per click.
- CPM: Cost per 1,000 impressions.
Why it matters: Helps assess ad cost-effectiveness.
5. Return on Ad Spend (ROAS)
The total revenue earned from ads divided by the amount spent on them.
Why it matters: This metric helps determine whether your ads are generating a positive return.
6. Frequency
The average number of times an individual views your ad.
Why it matters: A frequency above 3–4 can lead to ad fatigue.
Also Read: –
What’s A Good CTR For Facebook Ads? 8+ Expert Tips To Improve It
Top 8 Facebook Ad Metrics That Are Worth Tracking
7. Ad Relevance Score (Quality Ranking, Engagement Rate, Conversion Rate Ranking)
Facebook rates your ad based on engagement, quality, and conversion likelihood.
Why it matters: A low score means your ad needs improvements.
8. Video View Percentage (For video ads)
Measures how much of your video is being watched.
Why it matters: Helps determine if your video is engaging enough.
9. Lead Generation Metrics
Tracks sign-ups, form submissions, and other lead-related actions.
Why it matters: Critical for businesses focused on lead generation.
10. Ad Placement Performance
Compares how different placements (Instagram Stories, Facebook Feed, etc.) perform.
Why it matters: Helps you optimize placements for the best ROI.
Final Take: Master Your Facebook Ads Like a Pro!
Facebook Ads reporting isn’t just about crunching numbers—it’s your secret weapon for ad success! Without it, you’re flying blind, wasting budget, and missing out on serious ROI. But when you track the right metrics—impressions, CTR, conversions, ROAS—you unlock the power to fine-tune your strategy, maximize engagement, and drive real business growth.
Sure, Facebook Ads Manager gives you solid insights, but why stop there? If you really want to outsmart your competition, you need a tool that shows you what’s working for them—not just you. That’s where PowerAdSpy steps in. Get a front-row seat to the best-performing ads in your niche, spy on winning creatives, and skip the guesswork by using data-driven strategies that already deliver results.
Whether you’re a solo marketer, a growing brand, or an agency managing multiple clients, success in Facebook Ads is all about smart reporting and even smarter strategies. The data is there—now it’s time to use it to optimize, scale, and dominate!
FAQs:-
1. What’s the biggest mistake advertisers make with Facebook Ads reporting?
Many advertisers focus too much on vanity metrics like likes and shares instead of real performance indicators like ROAS and conversion rates. The key is to track data that drives revenue, not just engagement.
2. Why do some Facebook Ads perform well but suddenly stop getting results?
Ad fatigue, audience saturation, and algorithm shifts can all cause an ad’s performance to drop. Regularly monitoring your ad reports helps identify when it’s time to refresh creatives, adjust targeting, or test new strategies.
3. Can you spy on competitors’ Facebook Ads to improve your own campaigns?
Yes! While Facebook Ad Library offers some insights, advanced tools like PowerAdSpy provide deeper competitor data, revealing top-performing ads, targeting strategies, and ad creatives that are already converting.
4. How do you tell if an ad campaign is actually profitable?
The best way to measure profitability is by calculating Return on Ad Spend (ROAS) and Customer Acquisition Cost (CAC). If your ROAS is below 1, it means you’re losing money on ads.
5. What’s the best way to fix underperforming Facebook Ads?
If your ads aren’t converting, start by analyzing CTR, CPC, and relevance score. Sometimes, simple tweaks—like improving ad copy, changing visuals, or refining audience targeting—can turn a failing ad into a winning one.