
The ad you paused on day nine might have been your best performer by day thirty. That’s not a hunch — it’s the pattern I keep seeing when media buyers finally sit down and compare their kill decisions against what their competitors are actually running.
Most kill decisions are made in a vacuum. You watch CTR wobble for a week, your CPM climbs, and you pull the plug. Feels responsible. But without a benchmark — without knowing how long a genuinely profitable ad typically runs in your niche — you’re just guessing. And the guess is almost always too conservative.
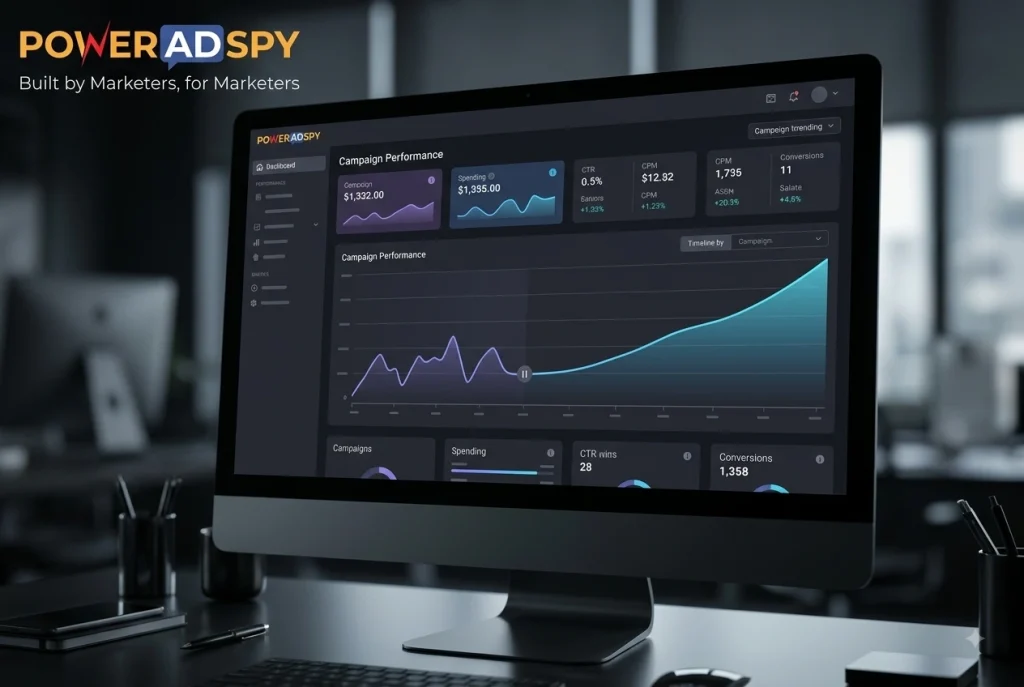
Here’s the shift that changes everything: use your competitors’ ad run-time to establish an ad longevity benchmark for your own kill thresholds. PowerAdSpy makes that benchmark accessible. The workflow isn’t complicated, but most buyers never think to build it.
Why Longevity Is the Signal You’re Ignoring
Neil Patel put it plainly in a 2025 walkthrough: “The longer the ad’s been running, the higher probability it’s generating a positive ROI — because why would companies keep spending?“ That’s it. That’s the whole argument. Advertisers aren’t charitable. If an ad is eating budget and returning nothing, it stops. The ones still running after sixty, ninety, or a hundred and twenty days? Those are the ones working.
This matters for your own account because ad longevity gives you a real-world reference point. If every profitable ad in your niche runs for at least six weeks before the creative gets refreshed, pulling your ad at day eight because the first-week numbers look soft is statistically premature. You’re not reading a death signal — you’re reading noise.
The problem is that most buyers have never actually looked at competitor run-times systematically. They rely on gut feel calibrated to their own account history, which is usually too thin to be meaningful. Competitor ad intelligence fixes that.
What “Longevity Research” Actually Looks Like in PowerAdSpy

The practical workflow starts with a search. You can query by keyword, by advertiser name, or by a competitor’s domain. Run a search for the core term your category competes on — say, the product type or the problem your offer solves. Then sort the results by date.
Sorting by date — oldest first — immediately surfaces the ads that have been running the longest. These are your ad longevity anchors. An ad that launched eight weeks ago and is still indexed hasn’t been paused. The advertiser is still paying for it. That’s a data point, not an assumption.
From there, the Engagement Oriented Details feature becomes the validation layer. An old ad with flat engagement might be a zombie — kept live by automation or oversight. An old ad with sustained comment and share activity is almost certainly still converting. The combination of run duration plus engagement signal is far more reliable than either one alone.
Use Bookmark The Best Ads to flag the long-runners that also show strong engagement. Over the course of a week of research, you’ll accumulate a reference set: ten or fifteen ads in your niche that have demonstrably survived. Look at the spread. Are they mostly running six to eight weeks? Twelve weeks? Are there outliers at twenty-plus weeks? That distribution is your category’s ad longevity baseline — and it’s built from real advertiser behavior, not a platform’s generic benchmark.
PowerAdSpy indexes over 15 million ads from more than 200 countries across over 50 ad networks, including Facebook, Instagram, Google, and YouTube. Across those networks, 500K+ new ads are added to the index daily. The depth of the data means your longevity baseline isn’t built from a thin sample — you’re working from a genuinely representative slice of what’s actually running in your category right now.
Building Your Kill-Threshold Framework
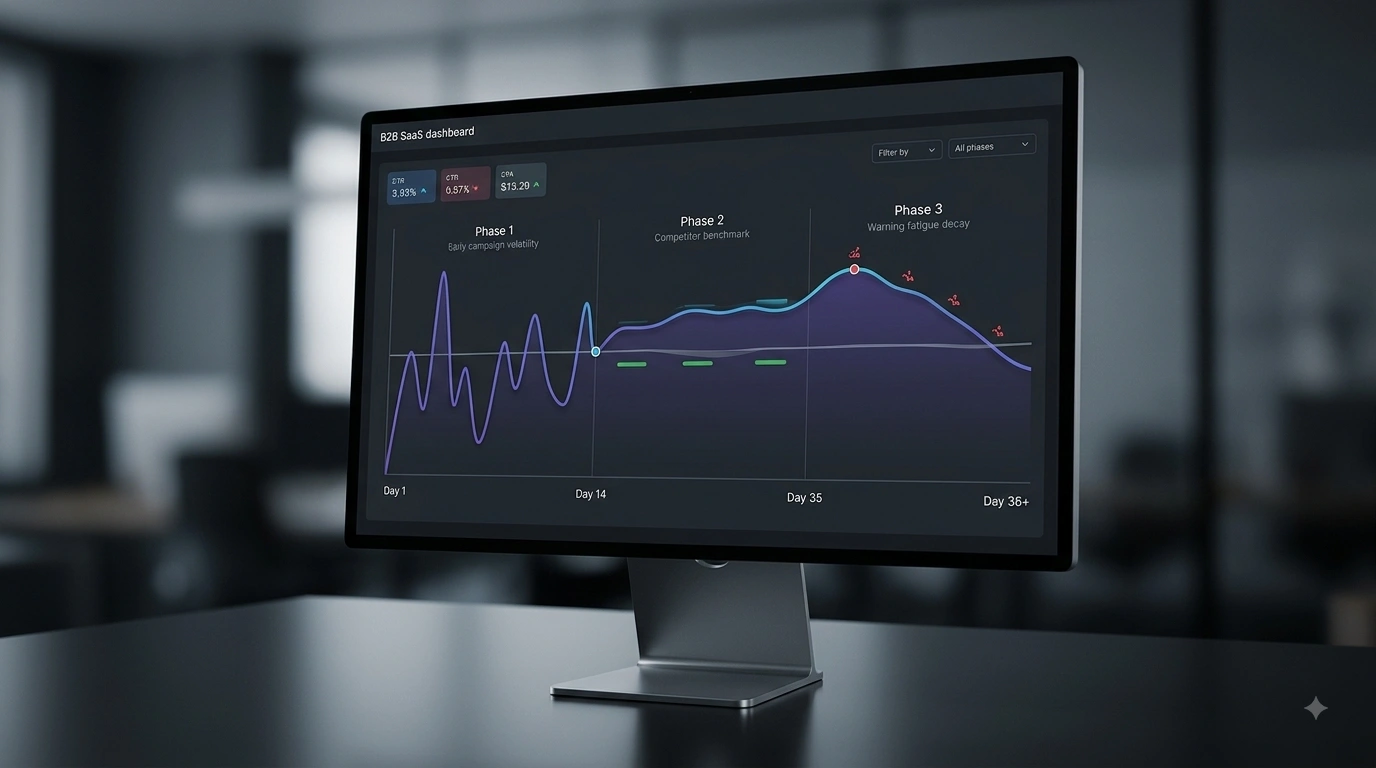
Here’s the framework I’d use. It has three tiers, and each one requires a different response — not a single kill-or-keep binary.
Tier 1: The Calibration Phase (Days 1–14)
Almost nothing meaningful is determined in the first two weeks. Your CPM is still finding its floor. The algorithm is still learning your audience. Use this period to flag, not to act. The only valid kill signal at this stage is a catastrophic cost-per-click with zero downstream conversion — not a soft CTR number in isolation.
Meanwhile, keep your PowerAdSpy research running in parallel. Use the GEO-targeted competitor data to filter by the markets you’re actually targeting, not a global average. A competitor’s ad that’s been running for twelve weeks in Germany and three weeks in Australia tells you two very different things about market maturity. Filter down to your actual geography — PowerAdSpy covers 100+ countries — before you set your threshold.
Tier 2: The Comparison Window (Days 15–35)
This is where your competitor ad longevity baseline starts to matter. If your research showed that the median profitable ad in your niche runs at least six weeks, a creative showing middling performance at day twenty is not a failed ad — it’s a mid-race assessment. Sproutbox’s agency research describes a discipline of killing underperforming ad sets quickly while reinvesting in winners. The key phrase is underperforming — defined relative to a benchmark, not in absolute terms against a number you invented before launch.
At this tier, the right question is: is this ad performing worse than the longevity floor my competitor research established? If yes, consider a pause or a creative test. If no, let it breathe.
Tier 3: The Refresh Decision (Days 36+)
If you’re still running at week five or six and performance is holding, you’re now in the territory where ad fatigue becomes the real risk. Audiences who’ve seen the same creative too many times stop paying attention — impressions keep registering, but the engagement signal decays. This is when competitor intelligence shifts function: instead of validating run-time, use it to research what hooks competitors refresh into when they rotate creative.
Search competitor ads by the same keywords, but filter for recently launched ads. What angles are they testing now? What calls to action are appearing in newer creative from established advertisers? Optimizing creative before fatigue forces your hand is the difference between a controlled refresh and an emergency response.
The Position and Format Variables Most Buyers Miss
Ad longevity alone doesn’t tell the whole story. An ad that’s been running for ten weeks in News Feed has survived a much more competitive placement than one running only in a sidebar or secondary position. PowerAdSpy’s Filter By Ad Positions feature lets you separate News Feed placements from Side Location placements when you’re building your longevity baseline.
This matters because the threshold you set for a News Feed ad should differ from the one you set for a side-placement ad. News Feed is more expensive, gets faster feedback, and tends to kill weak creative sooner. If a News Feed competitor ad is still running at eight weeks, that’s a stronger survival signal than a side-placement ad at the same age. Segment your reference set accordingly.
Call to Action Based Sorting adds another filtering layer. If you’re running a direct-response creative with a “Shop Now” CTA, compare your run-time against competitors running the same CTA type — not against brand-awareness creative with a “Learn More” button. Different CTA types optimize against different events and carry different natural lifespans. Mixing them in your baseline muddies the benchmark.
What This Workflow Won’t Tell You
Worth being direct about the limits. Competitor longevity data tells you about run-time, not about the specific economics behind that decision. You don’t know their target CPA, their margin structure, or their tolerance for break-even periods. A well-funded competitor might run an unprofitable ad for brand reasons you can’t see from the outside.
This is why the Engagement Oriented Details layer is essential — sustained engagement is a harder signal to fake with pure budget. And it’s why you filter by geography and CTA type rather than building a catch-all baseline. The tighter your comparison group, the more reliable the benchmark.
As one research breakdown on the difference between ad archives and ad intelligence tools put it: an archive surfaces ads; an intelligence layer connects competitor signal to decisions in your own account. That’s the distinction. PowerAdSpy’s sorting, filtering, and engagement data move it toward the intelligence end — but interpreting that data against your own account metrics is still your job.
The ad longevity framework above is a starting point, not a formula. Your category, your margins, and your platform mix will shift the thresholds. But starting from real competitor run-time data — rather than the default instinct to cut fast — will almost certainly extend the life of ads that deserved more runway.
Ad intelligence tools help measure ad longevity through three distinct methods: scraping, real-time monitoring, and creative analysis. How each method works as a separate research input is worth understanding before you build your first longevity baseline — each one answers a different question about what your competitors are actually doing.
Stop calibrating your kill decisions against your own thin account history. Your competitors have already run the experiment. Start your free PowerAdSpy trial and let a decade of indexed ad data set your thresholds instead.