

Why Google Ads Benchmarks Are A Huge Gift To Marketers
In 2024, Alphabet—Google’s parent company—reported total revenue of $350 billion, with approximately 75% of that, or around $262 billion, coming from advertising, underlining the continued importance and scale of Google Ads in the digital marketing ecosystem. But how do you know if your campaigns are actually performing well? That’s where understanding Google Ads benchmarks becomes essential. By comparing your metrics with reliable benchmarks, you can identify where you stand, spot areas for improvement, and set realistic goals.
Let’s explore the key performance metrics across different ad formats and industries to help you measure your success more confidently.
Why Google Ads Benchmarks Matter In Google Ads
Even the most seasoned advertisers often ask: Is this a good clickthrough rate? Are my CPCs too high? Should I be seeing better conversions?
Benchmarks bring context. Instead of working in isolation, you can use Google Ads industry benchmarks to align your expectations with what’s actually achievable. These data points not only highlight what works on average but also indicate where you’re leaving opportunities on the table.
Understanding Google Ads benchmarks helps you compare your campaign performance against others in your industry, so you can quickly identify what’s underperforming and what’s competitive. Whether you’re optimizing search, display, or shopping campaigns, benchmarks provide a clear reality check.
Next, let’s break down the numbers that really matter, starting with click-through rates.
Average Google Ads CTR Benchmark
Clickthrough rate (CTR) reflects how often someone clicks your ad after seeing it. It’s a vital performance indicator because a high CTR signals that your ad messaging, targeting, and placement are aligned with user intent.
Google Search ads typically enjoy a significantly higher CTR than display ads. According to recent Google ads benchmarks:
- Search Ads: 3.17% average CTR
- Display Ads: 0.46% average CTR
This contrast comes down to how users interact with each type. People using search are actively looking for something, which naturally increases engagement. On the other hand, display ads are passive—they appear while users are browsing, reading, or watching, so the engagement rates tend to be lower.
When we break it down by industry, the picture becomes even more interesting. Here’s how different sectors perform:
- Dating & Personals: 6.05%
- Travel & Hospitality: 4.68%
- Advocacy: 4.41%
- Technology: 2.09%
- B2B: 2.41%
- Consumer Services: 2.41%
If your CTR is lagging behind, especially below 2%, you should consider revisiting your ad creatives, testing different headlines, or refining your keyword match types and targeting strategy. Google ads industry benchmarks like these are a helpful checkpoint to know if your ads are underperforming or on track.
As CTR is just the beginning of the engagement funnel, in the next section, we’ll look at how much each of those clicks is costing you and what that means for your ad spend.
Also Read
Power Of Google Search Ads Strategy: A Complete Guide
Google Ads Competitor Analysis: A Comprehensive Guide
Average Cost-Per-Click (CPC) In Google Ads

Cost-per-click (CPC) indicates the price you pay for each click on your ad. It’s not just a line item in your budget—it can signal competitiveness, audience saturation, and keyword demand.
On average, here’s what advertisers are spending:
- Search Ads: $2.69 per click
- Display Ads: $0.63 per click
Again, this varies significantly by industry:
- Legal: $6.75
- Consumer Services: $6.40
- Technology: $3.80
- Ecommerce: $1.16
While it may seem intuitive to chase the lowest CPC, that’s not always the best move. High CPCs often come from competitive industries where leads are more valuable. It’s about the return on investment (ROI), not just the click price.
If your average CPC is draining your budget without solid returns, it’s worth auditing your keyword choices, bidding strategies, and ad relevancy. Monitoring current Google ad benchmarks can help you strike the balance between cost and quality.
Next, we’ll move from click costs to what really impacts your ROI—conversions.
What Are Average Google Ads Conversion Rates?

Conversion rate tracks the percentage of people who take a desired action after clicking your ad. That could be a sale, lead submission, app install, or any other meaningful metric tied to your campaign goals.
Here are the average conversion rates across Google Ads:
- Search Ads (eCommerce): 2.81%
- Display Ads: 0.59%
High-converting industries include:
- Dating & Personals: 9.64%
- Legal: 6.98%
- Consumer Services: 6.64%
Lower-performing sectors include:
- Advocacy: 1.96%
- Home Goods: 2.70%
If your current rates fall below 2%, you could be losing out on valuable leads and sales. Focus areas for improvement might include your landing page speed and structure, message alignment, mobile responsiveness, and even CTA visibility.
With consistent benchmarking against the latest google ads benchmarks by industry, you can spot performance gaps early and optimize accordingly.
But before we celebrate conversions, there’s one more metric to consider—how much those conversions are costing you. In the next section, we’ll explore cost-per-acquisition (CPA) averages and what they tell you about your campaign’s profitability.
Average Cost-Per-Action (CPA) In Google Ads
Cost per action (CPA) reflects how much you’re spending to get a conversion. It’s a critical metric when evaluating the effectiveness of your ad budget and understanding your overall Google Ads performance. High CPA can indicate inefficiencies, while a lower CPA suggests you’re getting more value for every dollar spent. As part of ongoing Google Ads benchmarks, this metric helps advertisers make smarter bidding and targeting decisions.
Average CPA for Search Ads in eCommerce: $45.27
Display Ads: $65.80
Industries with the highest CPA:
- Technology: $133.52
- Real Estate: $116.61
- B2B: $116.13
And the most efficient ones:
- Auto: $33.52
- Travel & Hospitality: $44.73
- Ecommerce: $45.27
Higher CPAs may not always be a red flag, especially if your average order value or customer lifetime value supports it. That’s why it’s important to interpret Google Ads benchmarks not in isolation, but alongside your business goals and margins.
Now that we’ve covered Search and Display campaigns, it’s time to look at benchmarks for Shopping Ads—another vital segment of your advertising strategy.
Google Shopping Ads Benchmarks

Google Shopping Ads are particularly valuable for e-commerce businesses. They offer visual placements that attract users who are closer to the point of purchase. These ads often perform differently from traditional search formats, which is why they deserve their own set of Google Ads benchmarks.
CTR for Shopping Ads Average: 0.86%
Top categories:
- Automotive Supplies: 1.20%
- HVAC & Climate Control: 1.12%
- Travel & Luggage: 0.99%
CPC for Shopping Ads Average: $0.66
Lowest costs:
- Art & Music: $0.34
- Child & Infant Care: $0.36
Highest:
- Office & Business Needs: $1.09
Conversion Rate Average: 1.91%
Top performers:
- HVAC & Climate Control: 3.30%
- Medical Supplies: 2.94%
CPA for Shopping Ads Average: $38.87
Lowest CPAs:
- HVAC & Climate Control: $7.28
- Art & Music: $19.03
Shopping ads tend to provide lower CPAs than Search, making them a good option for volume-driven campaigns. These ads typically deliver higher intent clicks and more granular targeting options, reinforcing their importance in any strategy backed by Google Ads benchmarks.
Next up, we’ll examine Google Display benchmarks in more det
Google Display Ads Benchmarks
Display ads focus on visibility and brand awareness. While performance metrics might be lower, these campaigns serve a different purpose.
Average CTR
Overall: 0.46%
Top performers:
- Real Estate: 1.08%
- Dating & Personals: 0.72%
Average CPC
Overall: $0.63
Industries with the highest CPC:
- Dating & Personals: $1.49
- Consumer Services: $0.81
Conversion Rate
Overall: 0.57%
Highest conversion rate:
- Dating & Personals: 3.34%
- Legal: 1.84%
CPA
Overall: $75.51
Highest:
- B2B: $130.36
- Education: $143.36
These numbers may seem less efficient, but Display is often used for retargeting and top-of-funnel strategies. Combine it with search or shopping for better results.
Knowing the Google Ads benchmarks is a great start, but what if you could go beyond averages and you can perform Google Ad competitor analysis, how often they show up, and what’s actually working? That’s where PowerAdSpy gives you a real edge.
PowerAdSpy Google Ad Spy Tool

PowerAdSpy is your all-in-one ad intelligence tool built for deep insights and smarter decisions. It supports ads across Facebook, Instagram, YouTube, Google, Native, Reddit, Quora, and LinkedIn, giving you full visibility into your competitors’ strategies across major platforms.
If Google Ads are part of your strategy, PowerAdSpy makes the difference between guesswork and informed decisions. It lets you explore real-time Google ad data, monitor competitor search and display ads, and uncover what’s driving results, not just what’s being served.
Here’s what you get with PowerAdSpy:
Advanced Search

PowerAdSpy’s powerful search algorithm lets you discover ads based on keywords, domains, or advertisers. Whether you’re tracking a specific competitor or exploring niche markets, this feature helps you pinpoint exactly the kind of ads you’re looking for, without wasting time.
Filter By Country

PowerAdSpy allows you to filter ads by country, giving you localized ad insights. This is especially useful for global campaigns or market-specific strategies, so you can analyze trends and creatives that resonate with audiences in various geographies.
Sort By Lander Properties
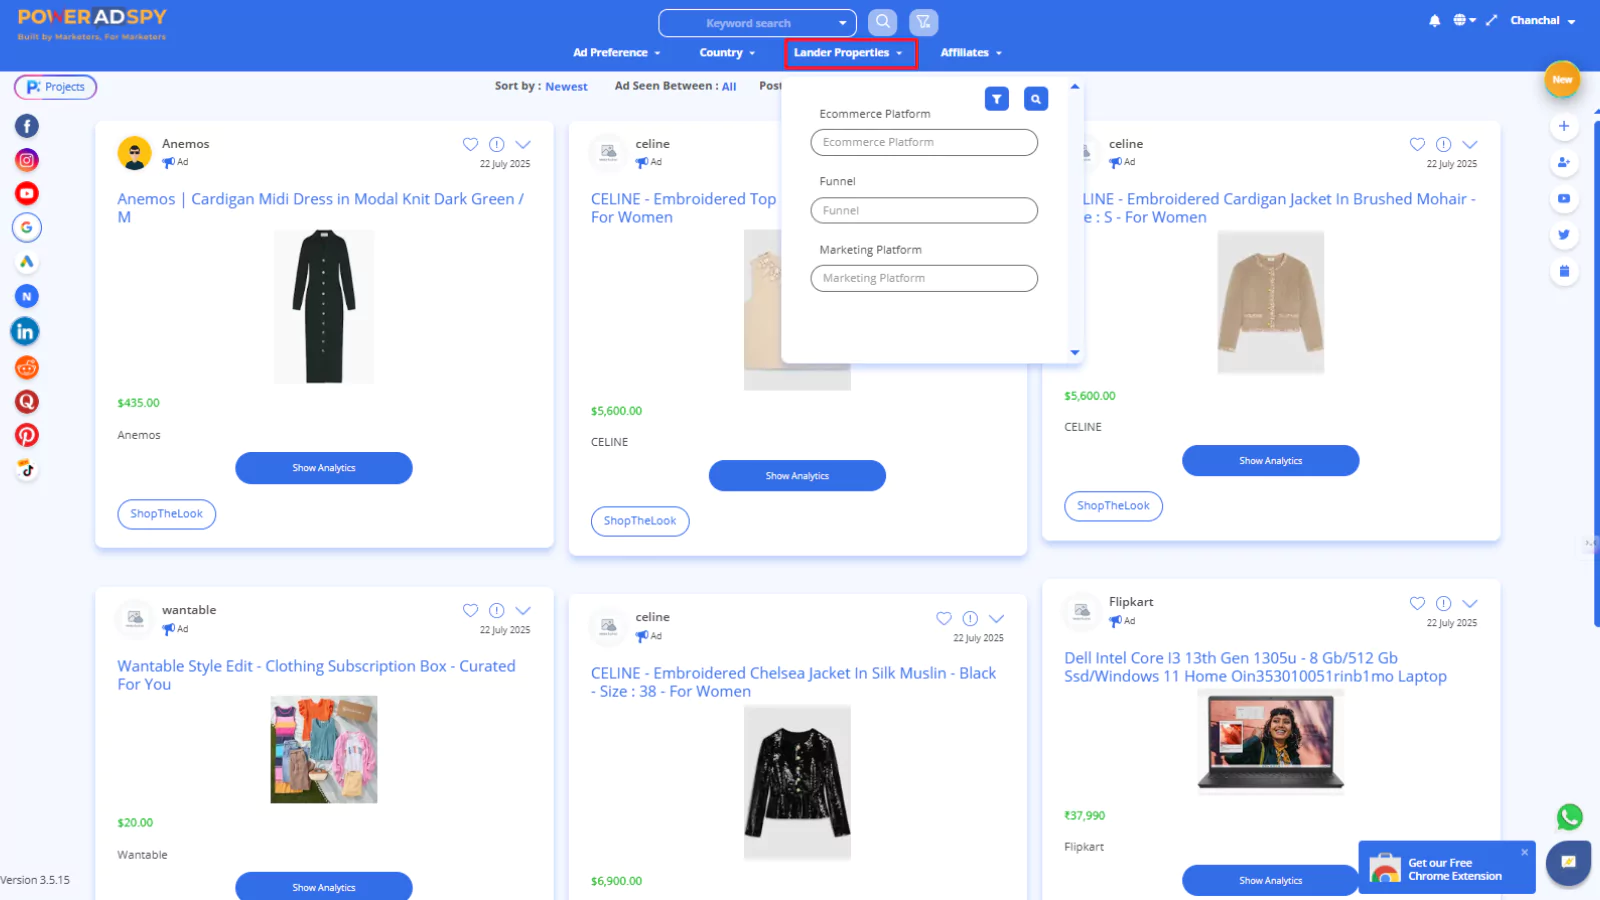
PowerAdSpy lets you dig deeper by organizing ads based on their landing page elements, funnel types, or marketing platforms (like Shopify, ClickFunnels, etc.). This helps you study the full customer journey, uncover funnel strategies, and find high-performing pages in your niche.
Complete Ad Visibility
With real-time access to live ads, you don’t just see static screenshots—you get a full view of how ads are performing in the moment. Monitor engagement metrics, such as likes, comments, and shares, to understand what truly captures attention and drives interaction
Ad Data from 100+ Countries
PowerAdSpy gives you access to a constantly growing database of millions of ads from over 100 countries. It helps you discover what’s working globally, within just a few clicks.
By combining real performance data with Google Ads benchmarks, PowerAdSpy enables you to understand what “good” really looks like in your niche and how your competitors are hitting those marks.
How To Use Google Ads Benchmarks To Improve Performance
Benchmark data is a guide, not a rulebook. But it can spotlight where you’re falling short or performing better than the average.
Here’s how to apply them:
- Set realistic KPIs based on your industry.
- A/B test creatives if CTR is low.
- Refine landing pages to improve conversion rates.
- Adjust bids if your CPCs are too high with little ROI.
Also, tracking industry trends through google ads benchmarks by industry helps you stay current with evolving performance standards.
Next, let’s wrap up with a quick recap.
Final Thoughts on Google Ads Benchmarks
Performance in Google Ads isn’t about perfection—it’s about consistency, testing, and staying informed.
Knowing where your campaigns stand across CTRs, CPCs, conversion rates, and CPAs empowers you to make smarter decisions.
Pair this data with insights from a strong google ad spy tool, and you’ll have the edge you need to continually grow your ad performance.
Explore your numbers, test boldly, and let these benchmarks be your compass.
Frequently Asked Questions (FAQs)
- How often are Google Ads benchmarks updated?
It can change frequently due to seasonality, algorithm updates, and shifts in consumer behavior. It’s a good idea to review updated benchmarks at least quarterly to ensure your strategy remains competitive. - Are Google Ads benchmarks different for mobile and desktop traffic?
Yes, performance can vary significantly between mobile and desktop. Benchmarks for CTR, CPC, and conversion rates often differ across devices. When analyzing Google Ads benchmark, segment your data by device for a clearer comparison. - What’s the best way to use Google Ads benchmarks for a new campaign?
Start by comparing your projected performance against the average CTR, CPC, and CPA for your industry. Use these benchmarks to set realistic KPIs and guide decisions like budget allocation, ad format, and bidding strategy. - How do Google Ads benchmarks differ between small and large businesses?
Larger businesses may benefit from lower CPAs and CPCs due to optimization at scale, but the core benchmarks remain industry-driven. Regardless of business size, these benchmarks help align your performance expectations with achievable outcomes.