

How to Create a Facebook Ads Report To Prove Your Marketing ROI
Every marketing manager knows the dreaded moment when leadership asks, “What’s our return on investment from Facebook advertising?” If you’re scrambling to pull together numbers that actually make sense, you’re not alone. Creating a comprehensive Facebook Ads Report that clearly demonstrates marketing ROI has become one of the biggest challenges facing digital marketers today.
While Facebook provides tons of data, translating those metrics into meaningful business insights that justify your ad spend is an entirely different story.
The problem isn’t a lack of data; it’s knowing which metrics matter, how to present them effectively, and most importantly, how to connect your advertising efforts directly to revenue growth.
Many marketers fall into the trap of reporting vanity metrics like reach and impressions, leaving executives questioning whether their marketing budget is being used wisely.
In this comprehensive guide, you’ll discover how to build Facebook ads reports that not only showcase your campaign performance but actually prove the financial impact of your marketing efforts.
We’ll walk through essential metrics, provide step-by-step instructions, share proven templates, and reveal the tools that can transform your reporting from confusing data dumps into compelling ROI stories.
Listen Podcast Now!
Why Facebook Ads Reporting Matters For Marketing ROI?

Creating an effective Facebook Ads Report isn’t just about compiling numbers; it’s about bridging the critical gap between digital marketing activities and tangible business outcomes.
Many marketing teams find themselves in a frustrating cycle where they spend significant budgets on Facebook advertising but struggle to demonstrate clear value to stakeholders and leadership.
The harsh reality is that 73% of marketing budgets get scrutinized when companies can’t see direct connections between ad spend and revenue growth.
Without proper reporting frameworks, even successful campaigns can appear as cost centers rather than profit drivers.
This disconnect often leads to reduced marketing budgets, limited campaign optimization opportunities, and missed growth potential.
Effective Facebook Ads Reporting transforms raw platform data into compelling business narratives.
When you can show that your $5,000 monthly ad spend generated $25,000 in qualified leads or directly contributed to a 40% increase in online sales, you’re not just reporting metrics, you’re proving marketing’s strategic value to the organization.
Smart reporting also enables data-driven decision-making.
Instead of relying on gut feelings or basic vanity metrics like clicks and impressions, comprehensive reports reveal which audiences convert best, which creative elements drive results, and where budget reallocation can maximize returns.
This level of insight empowers marketing teams to optimize campaigns proactively rather than reactively, ultimately driving better ROI and securing continued investment in digital advertising initiatives.
Essential Metrics To Include In Your Facebook Ads Report:
When building a comprehensive Facebook Ads Report, the metrics you choose can make or break your ability to demonstrate real marketing value.
Too many marketers get caught up in surface-level numbers that look impressive but don’t actually prove ROI to stakeholders.
The key is focusing on metrics that directly connect your ad spend to business outcomes.
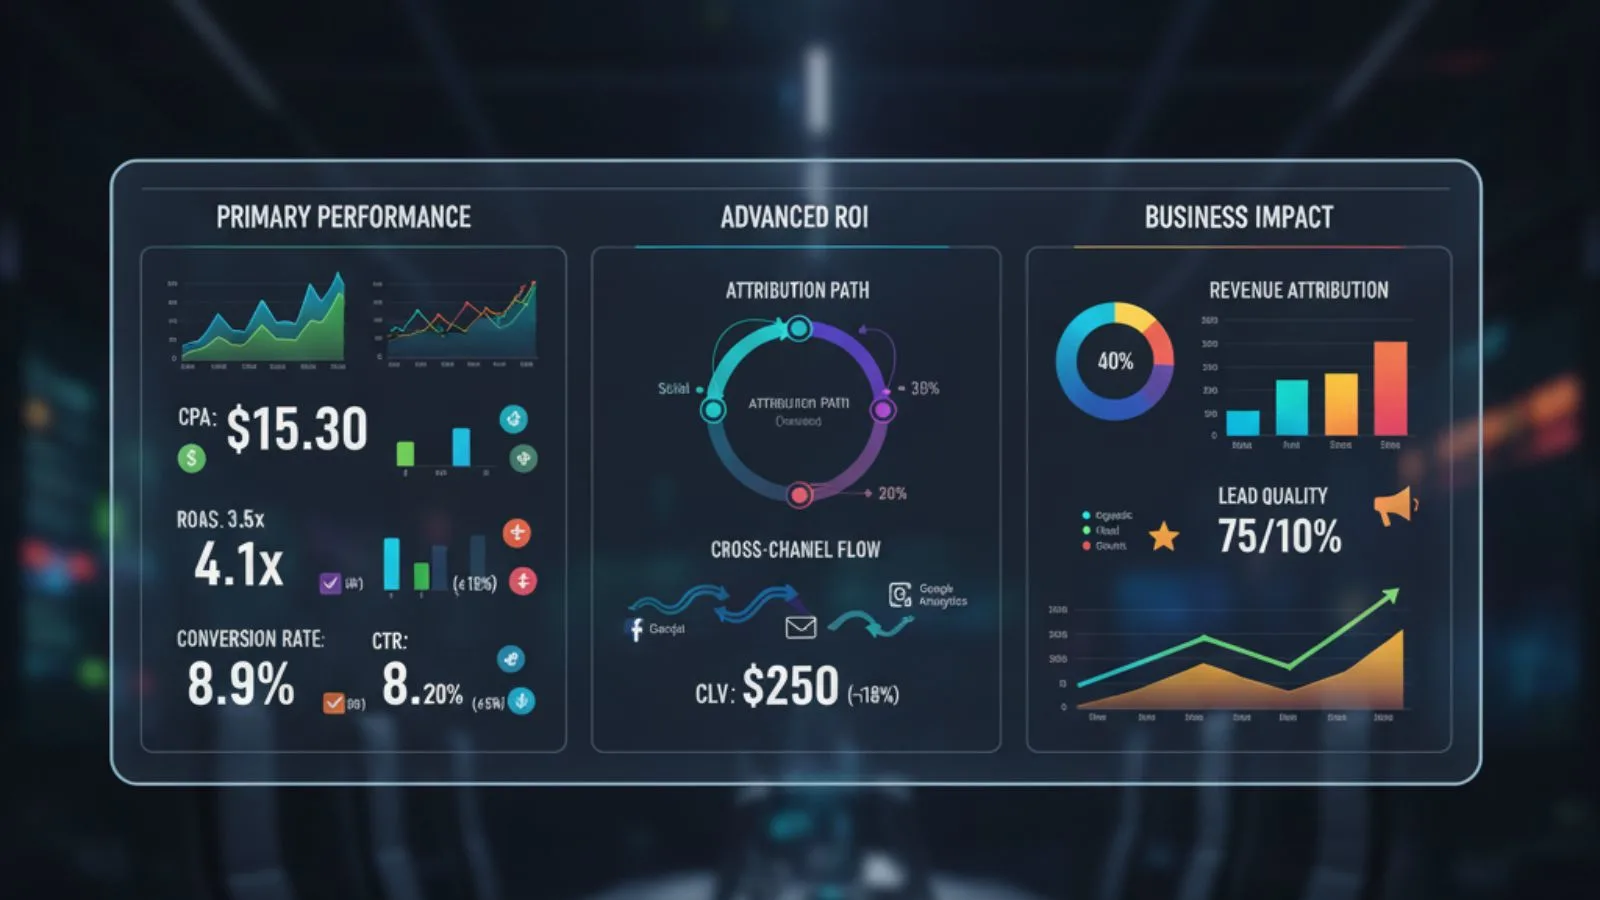
1. Primary Performance Metrics:
Start with the fundamentals that every decision-maker understands.
Cost Per Acquisition (CPA) shows exactly how much you’re paying to acquire each customer, while Return on Ad Spend (ROAS) reveals the revenue generated for every dollar invested.
Click-through Rate (CTR) indicates how compelling your ads are to your target audience, and Conversion Rate measures how effectively your landing pages turn clicks into customers.
2. Advanced ROI Metrics:
Go beyond basic metrics by including Customer Lifetime Value (CLV) calculations.
This shows stakeholders that your Facebook campaigns aren’t just generating one-time purchases, they’re building long-term customer relationships.
Attribution modeling becomes crucial here, especially when customers interact with multiple touchpoints before converting.
Cross-channel impact analysis helps you understand how Facebook ads influence conversions that happen through other channels.
3. Business Impact Metrics:
The most powerful metrics connect directly to your bottom line.
Revenue attribution tracking shows exactly which campaigns generated sales, while lead quality scores help differentiate between high-value prospects and tire-kickers.
Brand awareness lift metrics demonstrate the broader marketing impact beyond direct conversions.
Remember, the best reports tell a story that connects ad performance to business growth.
Choose metrics that align with your company’s specific goals, whether that’s driving immediate sales, building brand awareness, or generating qualified leads for your sales team.
Step-By-Step Guide To Building Your Facebook Ads Report:

Creating an effective Facebook Ads Report doesn’t have to be overwhelming.
Many marketers struggle with transforming raw campaign data into compelling stories that demonstrate clear business value.
The key lies in following a systematic approach that connects your advertising metrics to actual ROI outcomes.
Here’s your complete roadmap to building reports that not only impress stakeholders but also drive smarter marketing decisions.
Step 1: Define Your Reporting Objectives:
Before diving into data, clarify who will read this report and what decisions they need to make.
Are you reporting to executives focused on revenue growth, or marketing managers optimizing campaign performance?
Your audience determines which metrics matter most.
Step 2: Select Strategic Time Frames:
Choose reporting periods that align with your business cycles.
Compare current performance against previous months, quarters, or year-over-year data to provide meaningful context.
Always include comparison periods to show trends and progress.
Step 3: Extract Data from Multiple Sources:
Pull performance data from Facebook Ads Manager, but don’t stop there.
Integrate Google Analytics, CRM systems, and sales data to create a complete picture of customer journeys and actual conversions.
Step 4: Organize by Campaign Objectives:
Structure your report around business goals rather than just campaign types.
Group awareness campaigns are separate from conversion-focused efforts, making it easier to evaluate performance against specific objectives.
Step 5: Calculate True ROI Metrics:
Go beyond platform metrics like clicks and impressions. Calculate cost per acquisition, return on ad spend, and customer lifetime value to demonstrate real business impact.
Step 6: Create Visual Data Stories:
Transform numbers into compelling visuals using charts, graphs, and dashboards. Visual representations make complex data digestible and highlight key trends at a glance.
Step 7: Add Strategic Context:
Raw numbers mean nothing without context. Explain what caused performance changes, market factors affecting results, and external influences on campaign effectiveness.
Step 8: Include Actionable Recommendations:
End each section with specific, actionable next steps. Whether it’s budget reallocation, audience refinement, or creative optimization, give stakeholders clear directions for improving future performance.
Facebook Ads Report Template And Structure:

Creating a well-structured Facebook Ads Report requires a systematic approach that transforms raw data into actionable insights.
Your report should begin with an executive summary highlighting key performance indicators and overall campaign ROI.
This section gives stakeholders a quick overview without diving into granular details.
The campaign performance breakdown forms the core of your Facebook Ads Report Template.
Organize data by campaign objectives, ad sets, and individual ads to identify what’s driving results.
Include metrics like cost per acquisition, return on ad spend, and conversion rates alongside visual charts that make trends immediately apparent.
Don’t overlook the audience insights presentation. Show demographic breakdowns, interest targeting performance, and behavioral patterns that influence campaign success.
The budget allocation section should demonstrate spending efficiency across different campaigns and audience segments.
For practical implementation, downloading a Facebook Ads Report Template Free resource can significantly streamline your reporting process.
Many marketers find success by studying a proven Facebook Ads Report Example to understand proper structure and presentation flow.
Remember to conclude each report with actionable recommendations based on your data analysis.
This transforms your report from a simple data dump into a strategic document that guides future advertising decisions and demonstrates clear marketing value.
Competitive Intelligence: Using Facebook Ad Spy Tools For Better Reporting:

Understanding your competitors’ performance is crucial for creating meaningful context in your Facebook Ads Report.
Without industry benchmarks, your metrics exist in a vacuum, making it difficult to determine whether your 2.5% CTR represents success or needs improvement.
Facebook ad spy tool platforms provide invaluable competitive intelligence that transforms your reporting from basic performance updates into strategic business insights.
These tools reveal competitor ad creatives, targeting strategies, and engagement patterns across your industry.
The benefits of Facebook ad spy extend beyond simple competitor analysis.
You can identify seasonal trends, discover high-performing ad formats, and benchmark your results against industry leaders.
This competitive context helps stakeholders understand whether your campaigns are outperforming the market or require strategic adjustments.
When presenting your Facebook ads data, include competitor comparison sections that highlight your competitive advantages.
For instance, if the industry average CPC is $2.50 and yours is $1.80, this context dramatically strengthens your ROI story.
Smart marketers use competitive intelligence to set realistic expectations, justify budget allocations, and identify optimization opportunities that drive superior performance in increasingly competitive digital landscapes.
Also Read:
Facebook Ads Reporting: How to Track Performance Easily
How to Run Facebook Ads: Step-by-Step Guide For Advertising
Comprehensive Facebook Ad Reporting Made Easy with PowerAdSpy:

Creating a comprehensive Facebook Ads Report that truly demonstrates marketing ROI requires more than just internal campaign data.
You need competitive intelligence to provide context, benchmarks, and strategic insights that elevate your reporting from basic metrics to actionable business intelligence.
PowerAdSpy transforms how marketers approach Facebook advertising analysis by offering unprecedented access to competitor strategies and market trends.
This powerful platform houses over 5 million Facebook ads from across industries, giving you the competitive edge needed to create reports that impress stakeholders and drive results.
Key Features That Enhance Your Reporting:
- Discover Winning Ad Creations: PowerAdSpy helps you identify top-performing and high-converting ads across Facebook, revealing what’s truly working in your niche.
- Ad Popularity & Impression Score: Get detailed insights into each ad’s performance with popularity ratings and impression scores to understand audience engagement and conversion potential.
- Smart Search Options: Easily find the most relevant ads by searching through keywords, advertiser names, or brand names—all in one platform.
- Advanced Filter Controls: Narrow down your search with precise filters by niche, ad type, placement, and engagement metrics to uncover the ads that matter most to your strategy.
- Sort by Newest & Date Range: Discover the most recent and trending ads using the “Sort by Newest” option or explore campaigns seen between specific dates for timely market insights.
- Ad Budget Estimation: Gain a competitive edge with PowerAdSpy’s unique feature that helps you estimate the budget behind top-performing ad campaigns, giving you a clearer idea of what competitors invest in successful promotions.
How PowerAdSpy Elevates Your Reports: When you integrate competitive intelligence into your Facebook ads reporting, you move beyond isolated performance metrics to strategic market positioning.
Instead of simply showing that your CTR increased 15%, you can demonstrate that your campaigns outperform industry averages by 23%.
PowerAdSpy’s comprehensive analytics enable you to identify opportunities, justify budget allocations, and present data-driven recommendations that resonate with decision-makers.
Transform your reports from routine updates into strategic presentations that secure increased investment and showcase your marketing expertise.
Conclusion:
Creating an effective Facebook Ads Report isn’t just about compiling numbers; it’s about transforming data into a compelling narrative that proves your marketing value.
Throughout this guide, we’ve explored how to build reports that go beyond vanity metrics to showcase real business impact and ROI.
The key lies in focusing on metrics that matter to your stakeholders, presenting data with clear context, and always connecting ad performance to bottom-line results.
Remember, your report should tell the story of how your marketing efforts drive revenue, reduce acquisition costs, and contribute to business growth.
Don’t let poor reporting hold back your marketing budget or credibility.
Start implementing these strategies today, download our free templates, analyze your competitor landscape with spy tools, and transform your reporting approach.
Your stakeholders will appreciate the transparency, and you’ll gain the confidence that comes with data-driven decision-making.
Ready to take your reporting to the next level?
Access our comprehensive templates and discover how PowerAdSpy can provide the competitive intelligence that makes your reports even more powerful and persuasive.
(FAQ’s):
Q1: How often should I create a Facebook Ads Report?
For active campaigns, generate weekly reports for optimization decisions, monthly reports for stakeholder reviews, and quarterly comprehensive analyses for strategic planning.
Q2: What’s the difference between Facebook’s native reporting and custom reports?
Facebook’s native reports show platform-specific metrics like clicks and impressions, while custom reports connect these metrics to actual business outcomes and revenue impact.
Q3: How do I calculate true ROI from my Facebook advertising?
Include all costs (ad spend, management fees, creative production) and measure long-term customer value, not just immediate conversions. Factor in attribution windows and repeat purchases.
Q4: Can I automate my Facebook ads reporting process?
Yes, through Facebook’s API, third-party analytics tools, or business intelligence platforms that pull data automatically and generate scheduled reports.
Q5: What should I do if my ads show negative ROI?
Analyze audience targeting, creative performance, and landing page conversion rates, and consider testing different campaign objectives or budget allocations before making drastic changes.